Using CBP’s Enforcement Statistics to Assess Forced Labor Risk in the Supply Chain
By Jennifer Horvath, Partner
Harold Jackson, Associate Attorney at Braumiller Law Group PLLC
The U.S. continues to spearhead enforcement against imported goods that were made using forced labor, and public enforcement statistics can help your company assess risks of forced labor. Under the Uyghur Forced Labor Prevention Act (UFLPA), a statute that bans the importation of all goods made in the Xinjiang Uyghur Autonomous Region (XUAR) in China, and under Withhold Release Orders (WRO) and Findings authorities derived from 19 U.S.C. § 1307, U.S. Customs & Border Protection (CBP) is actively targeting and excluding or seizing goods it believes were made using forced labor. Recent trade enforcement statistics show an exponentially heightened crackdown on forced labor entries. Further, specialized databases provide additional levels of information which are critical to identifying and mitigating risk. CBP utilizes these private databases, thus having access to this information shows an importer what CBP is looking at when determining a potential for forced labor and UFLPA enforcement actions. The below statistical information recently published by CBP is helpful as a first step in better understanding what lays ahead in forced labor enforcement.
CBP publishes forced labor trade enforcement statistics on its website, which consists of CBP’s Trade Statistics[1] that include general forced labor entries targeted and value, CBP’s Forced Labor homepage that primarily include statistics regarding enforcement of WROs and Findings,[2] and CBP’s Forced labor Enforcement Statistics Dashboard.[3] The newest addition, the dashboard statistics, are updated quarterly and do not include data on other forced labor areas enforced by CBP, such as withhold release orders or findings under to 19 U.S.C. § 1307 and 19 C.F.R Part 12 or Countering America’s Adversaries Through Sanctions Act (CAATSA) pursuant to 22 U.S.C § 9241a.
The Trade Statistics for forced labor enforcement statistics show that in 2018, CBP targeted a mere six (6) forced labor entries at a total entry value of $218,000. This is a stark difference to the 1,469 targeted entries at a total value of $486 million in 2021, or the 2,398 targeted entries at a total value of $466 million. See the table below containing the enforcement statistics, courtesy of CBP’s Trade Statistics.
| CBP Trade Enforcement Statistics | 2018 | 2019 | 2020 | 2021 | 2022 |
| Forced Labor Entries Targeted | 6 | 12 | 314 | 1,469 | 2,398 |
| Forced Labor Entry Value | $218 thousand | $1.2 million | $49.8 million | $486 million | $466 million |
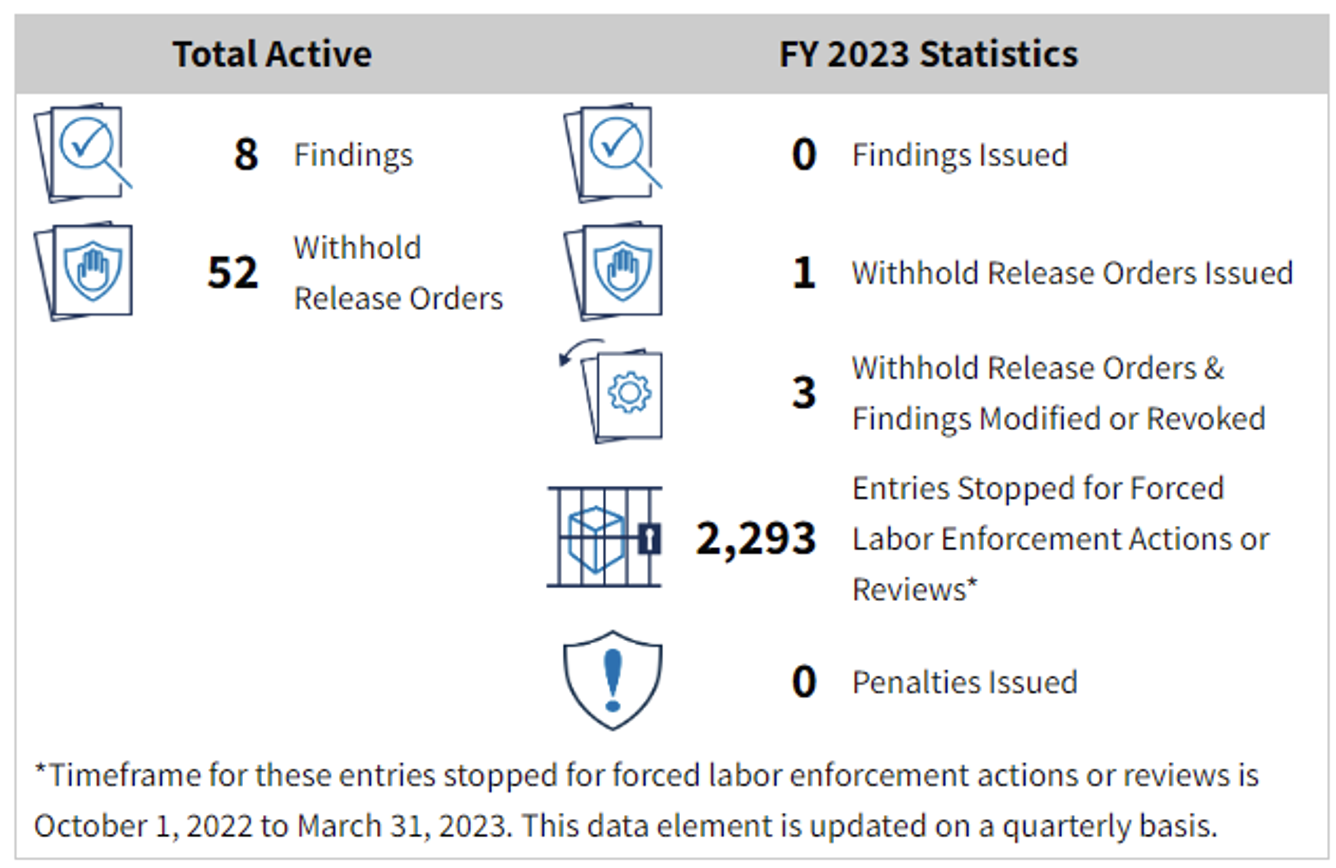
Based on the trade enforcement statistics for this year thus far, 2023 may prove to be a year of even greater enforcement. Between October 1, 2022, and March 31, 2023, CBP already stopped 2,293 entries for forced labor enforcement action or reviews, which reflects CBP’s efforts to enforce the current 52 WROs and 8 Findings currently in force. See the informative graphic below, which is provided on CBP’s Forced Labor homepage and updated periodically.

CBP’s Forced labor Enforcement Statistics Dashboard, which only comprises data regarding the UFLPA, provides an outlook of recent trade enforcement in greater detail. CBP’s accompanying guidance for the dashboard provides that CBP approaches UFLPA enforcement based on high-risk entities basis, rather than a hotspot industry or type of merchandise. Instead, CBP is targeting individual companies, although there continue to be high-risk industries and merchandise types, such as electronics, cotton, tomatoes, and silica. The information graphics, which represent enforcement data from 2022 and 2023 respectively, can be viewed on CBP’s website here: https://www.cbp.gov/newsroom/stats/trade/uyghur-forced-labor-prevention-act-statistics.
As of April 3, 2023, CBP already beat its records 2022. CBP targeted 2,058 total targeted shipments at a higher total shipment value of $607 million, compared to 1,530 and $470 million for 2022. Further, CBP’s denied shipments jumped from 196 to 294 from 2022 to 2023, with 701 released shipments for UFLPA enforcement compared to the 622 released shipments in 2022. These numbers, which are expected to become far greater throughout the year, show that CBP has allocated more time and resources to UFLPA enforcement.
It is evident from the Forced Labor Enforcement Statistics Dashboard that CBP is shifting its focus to certain industries while consistently putting targeting pressure on some of the same goods. For example, Electronics, which broadly includes a wide range of products, continues to be the greatest focus for CBP enforcement of the UFLPA. CBP targeted 1,045 shipments of electronics in 2022 and 708 shipments in 2023 so far, which represents the most enforcement for any other shipment those years. However, 2023 has seen growth in enforcement of other industry areas, such as greater focus on apparel, footwear and textiles, industrial manufacturing materials, and agriculture products, consumer goods, pharmaceutical products, base metals, machinery, and auto and aerospace products. The enforcement growth areas most prevalent are in apparel, jumping from 191 to 487 targeted shipments from 2022 to 2023, industrial materials, jumping from 58 to 452 targeted shipments from 2022 to 2023, and base metals, jumping from 5 to 52 targeting shipments from 2022 to 2023. Notice that the industry areas in focus for the dashboard largely mirror the industry categories of CBP’s Centers for Excellence and Expertise (CEEs), indicating how each Center is currently focusing on forced labor enforcement.
It is also important to note that for both 2022 and 2023, shipments from China were not even close to the greatest number of shipments targeting for UFLPA enforcement. Rather, Malaysia and Vietnam continue to be the shipment origin for UFLPA enforcement. This can be largely attributed to the UFLPA’s strict requirement that inputs and components of imported merchandise must also be free of forced labor, targeting a product’s entire upstream supply chain. The shipments targeted from Malaysia and Vietnam are likely determined by CBP to contain some material or component that was made using forced labor to be caught under UFLPA enforcement.
U.S. companies should be conducting risk assessments of their supply chains and be prepared to enhance and bolster their compliance programs. Public trade statistics in conjunction with specialized databases are useful tools when evaluating supply chain risk, with a focus on merchandise or industry type as well as country of origin. U.S. companies will likely need the professional assistance of third-party tracing and data providers, as well as outside trade counsel, when conducting a risk assessment for forced labor in the supply chain. For any additional inquiries, or if you would like to discuss forced labor enforcement in more detail, please contact Jennifer Horvath at Jennifer@braumillerlaw.com, or Harold Jackson at Harold@braumillerlaw.com.
[1] https://www.cbp.gov/newsroom/stats/trade
[2] https://www.cbp.gov/trade/forced-labor
[3] https://www.cbp.gov/newsroom/stats/trade/uyghur-forced-labor-prevention-act-statistics
Read more articles by these authors:
Jennifer: https://www.braumillerlaw.com/author/jenniferhorvath/


